fill = var_name
x = var_name
facet_grid(. ~ var_name)
fill = var_name_1
x = var_name_2
x = var_name_1
facet_grid(. ~ var_name_2)
Using the ggplot2::geom_histogram() function
ggplot2::geom_histogram()
library(tidyverse) # super helpful everything, including ggplot
Reminder: Steps before the ggplot() are combined with pipes %>%, whereas layers of the plot are combined with the addition symbol +.
ggplot()
%>%
+
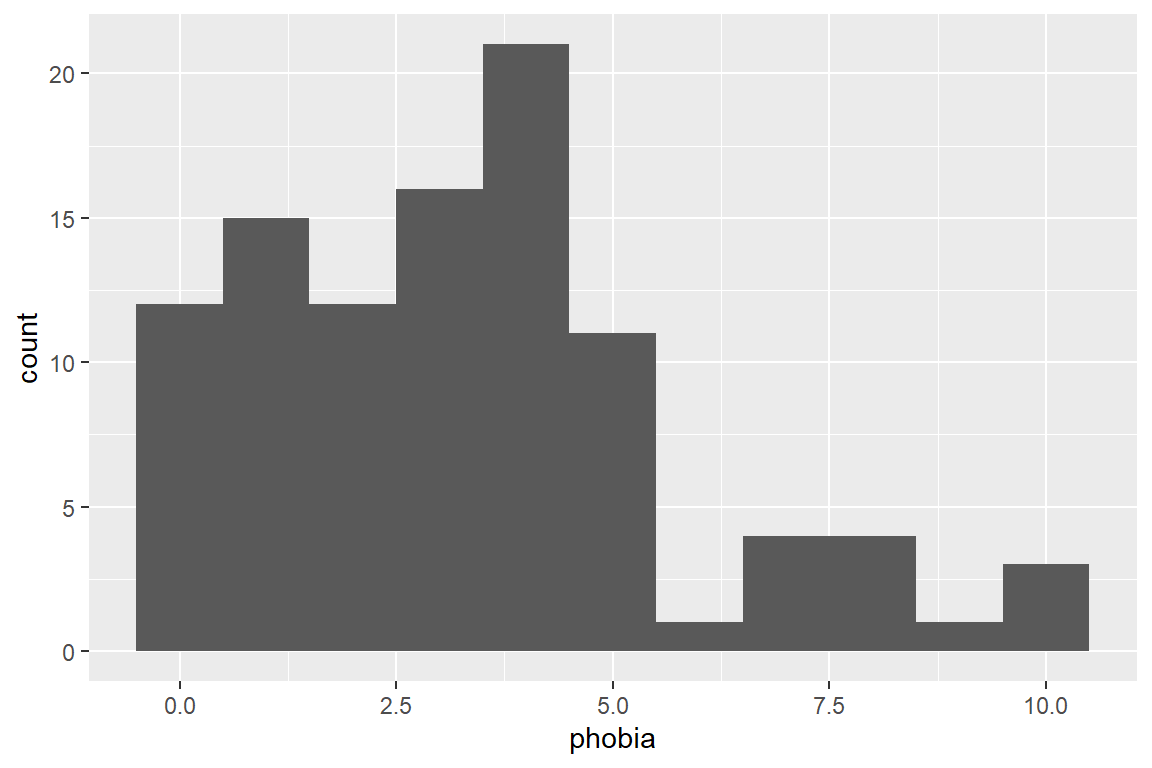
data_ihno %>%
  ggplot(aes(phobia)) +
  geom_histogram()
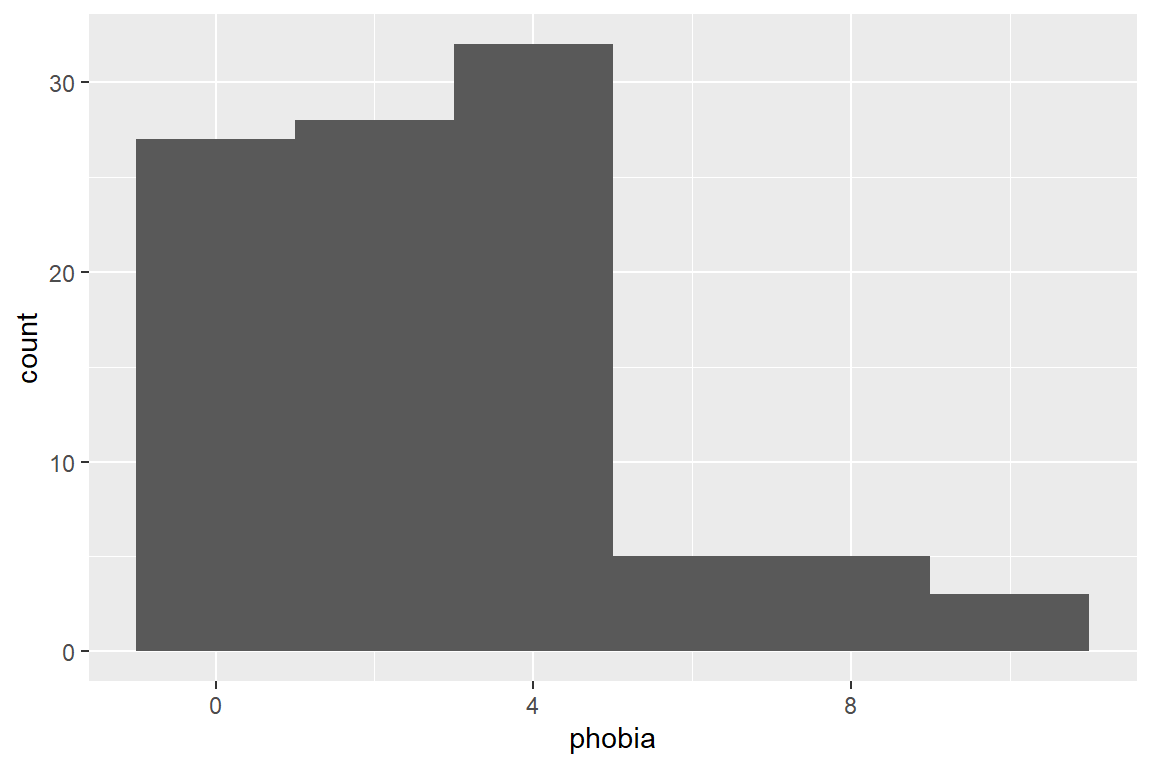
data_ihno %>%
  ggplot(aes(phobia)) +
  geom_histogram(bins = 6)
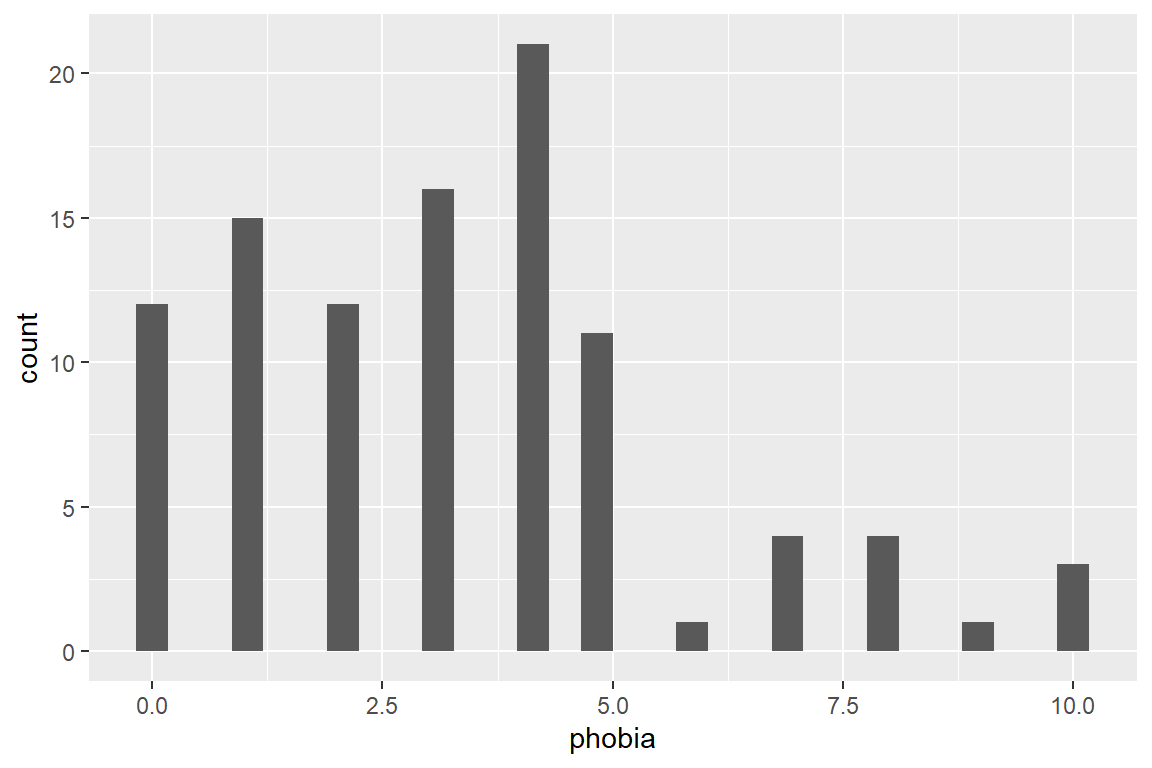
data_ihno %>%
  ggplot(aes(phobia)) +
  geom_histogram(binwidth = 1)
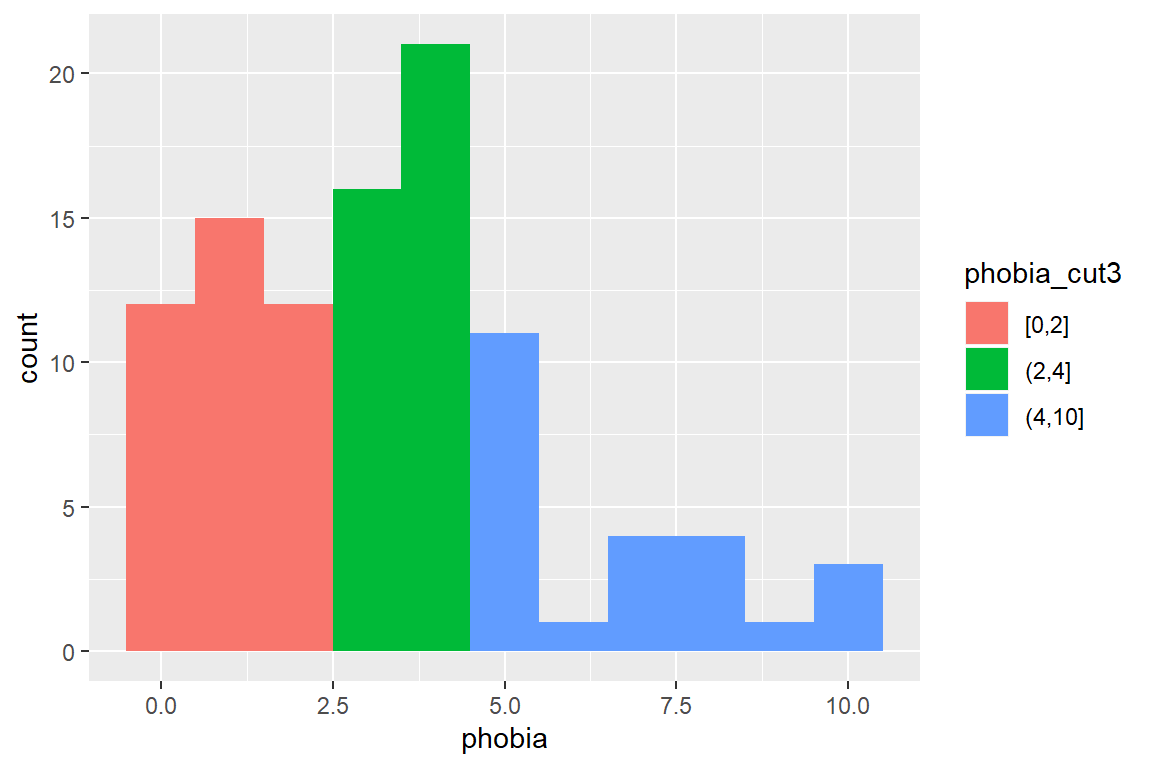
data_ihno %>%
  dplyr::mutate(phobia_cut3 = cut(phobia,
                                  breaks = c(0, 2, 4, 10),
                                  include.lowest = TRUE)) %>%
  ggplot(aes(phobia,
             fill = phobia_cut3)) +
  geom_histogram(binwidth = 1)