4 Example Articles
4.1 Cross-sectional: clustered or hierarchical
4.1.1 Non-randomized Intervention
Efficacy Study of Zearn Math in a Large Urban School District
Note: The schools chose where to implement the ‘treatment’ (n = 15) or not (n = 20).
| Concept | Article Details |
|---|---|
| Terms | hierarchical linear modeling (HLM) |
| Samples |
|
| Missing | none noted |
| Centering | none noted |
| Components | descriptives, HLM, followup subgroup analysis (seems link only random intercepts) |
| Results | No plots, only tables presenting the main effect (treatment) and excluding covariates and variance components, effect sizes looks like the are Cohen’s d? |
| Software | Stata |
4.1.2 Dyadic Design
Parent couples’ participation in speech-language therapy for school-age children with autism spectrum disorder in the United States
| Concept | Article Details |
|---|---|
| Terms | ICC, multilevel models |
| Samples |
|
| Missing | Only a small proportion of missing data, so composite variables were imputed using the expectation–maximization (EM) algorithm |
| Centering |
|
| Components | Null for ICC, Random intercepts (no random slopes), residual diagnostics |
| Results | Table with 3 MLM models, discussed moderation |
| Software | HLM (Version 7.01) using restricted maximum likelihood |

4.1.3 Binary Outcome
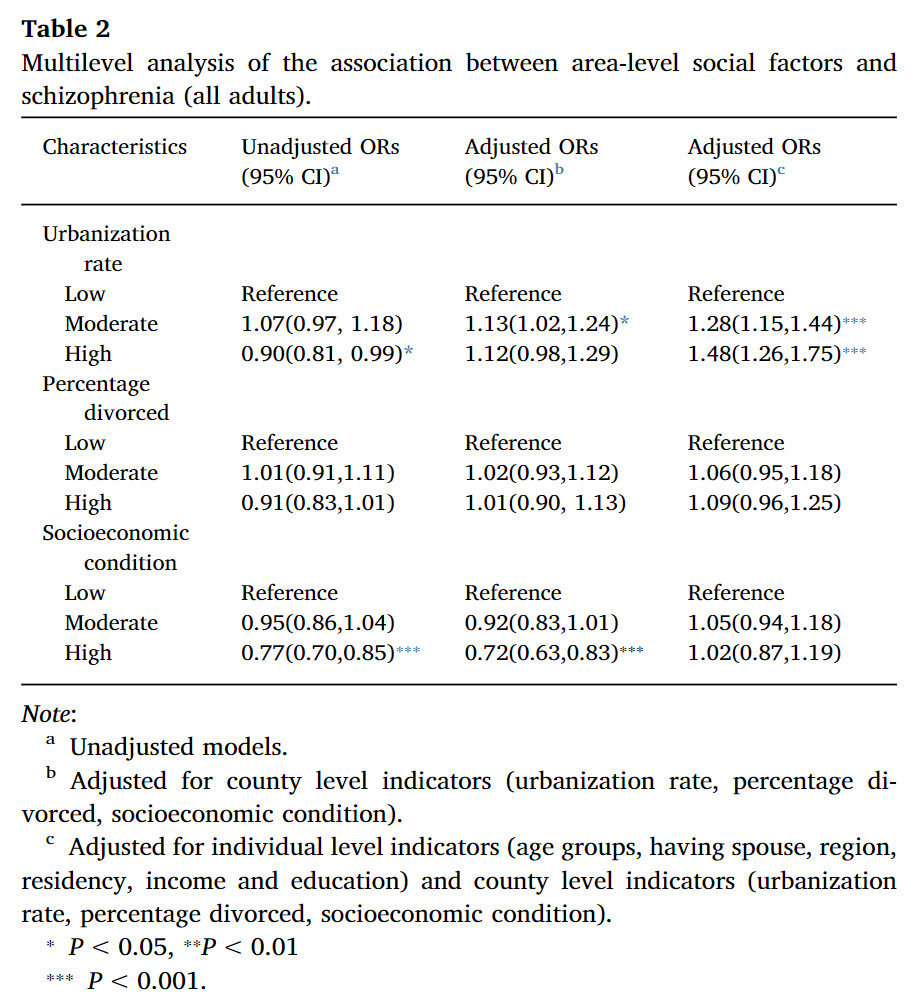
County-level social factors and schizophrenia: A multilevel study of 1.9 million Chinese adults
| Concept | Article Details |
|---|---|
| Terms | multilevel logistic regression |
| Samples |
|
| Missing | -not mentioned- |
| Centering | -not mentioned- |
| Components | ICC, adjusted odds ratios from GzLMM, subgroup analysis by gender |
| Results | Tables of un-adjusted and adjusted odds ratios |
| Software | Stata version 13.0 for Windows |
4.2 Repeated Measures: longitudinal (change over time) or conditional (no time component)
4.2.1 Repeated Measures - linear growth
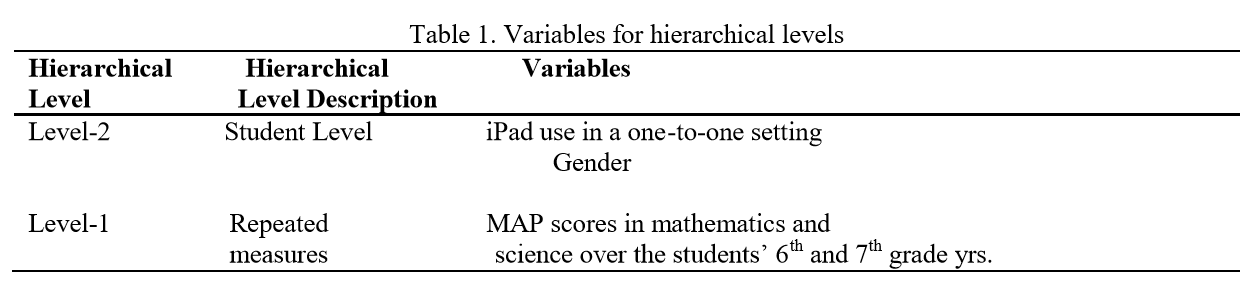
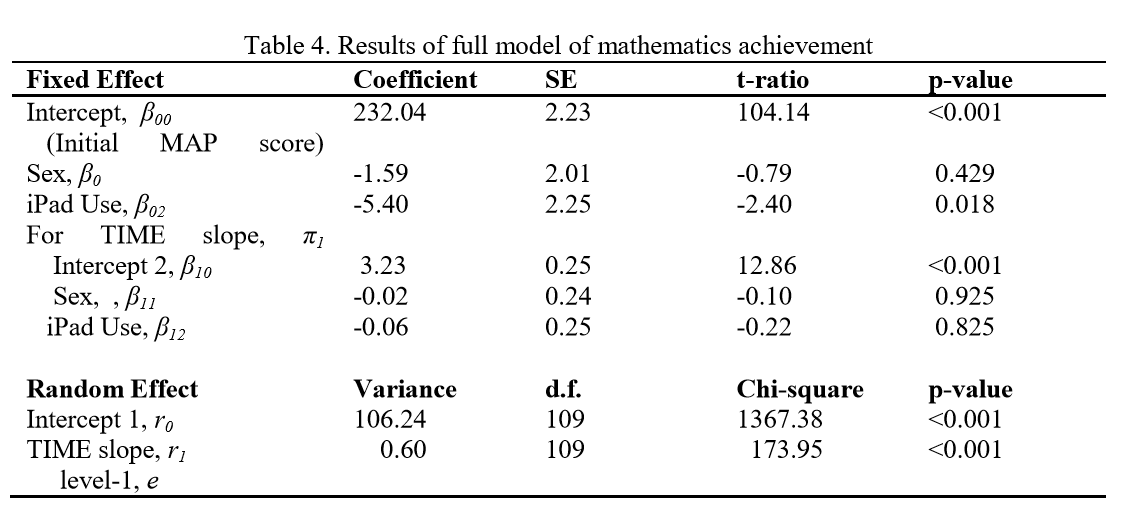
One-to-one iPad echnology in the Middle School Mathematics and Science Classrooms
| Concept | Article Details |
|---|---|
| Terms | hierarchical linear modeling (HLM) |
| Samples |
|
| Time | Unclear, but assume time is treated as 6 equally spaced intervals (t = numeric: 0, 1, 2, 3, 4, 5) |
| Missing | Students were not eliminated if they did not have six scores since HLM allows for missing data at the first level (i.e. complete case analysis) |
| Centering | grand mean centering for the MAP test scores |
| Components | Single-level OLS, Null model HLM, RIAS (random slope for time), add covars |
| Results | Table showing design, nested equations, several ‘final’ model tables of results |
| Software | SPSS |
4.2.2 Cohort sequential or accelerated longitudinal design
Examining the Links Between Received Network Support and Marital Quality Among Mothers of Children with ASD: A Longitudinal Mediation Analysis
| Concept | Article Details |
|---|---|
| Terms | multilevel modeling (MLM), conditional growth model, longitudinal multiple mediation models |
| Samples |
|
| Time | Unclear, assume time is measured in years at study years 5, 7, and 9 (t = numeric age at each observation) |
| Missing | Assumed data was missing at random, so complete-case analysis |
| Centering | Time-varying predictors and mediators were disaggregated into their constituent within and between-person effects. To assess within-person effects, Level 1 predictors were created by person-mean centering each predictor or mediator (i.e., subtracting each mother’s cross-time mean score on a predictor from her actual score on that measure). Level 2 predictors were created by first computing a cross-time mean score on a predictor for each mother and then grand-mean centering that score. Finally, baseline child problem behavior severity was grand-mean centered with a mean of zero. |
| Components | Bivariate correlation matrix at baseline, Null for ICC, add fixed effects, mediation |
| Results | MLM only reported in text. All tables and figures apply to the mediation |
| Software | SPSS 25.0 with MLmed, a macro which tests for mediation and moderated mediation in multilevel data, Restricted maximum likelihood, 95% confidence intervals (CIs) based on Monte Carlo bootstrapping estimates |
4.2.3 SEM Framework
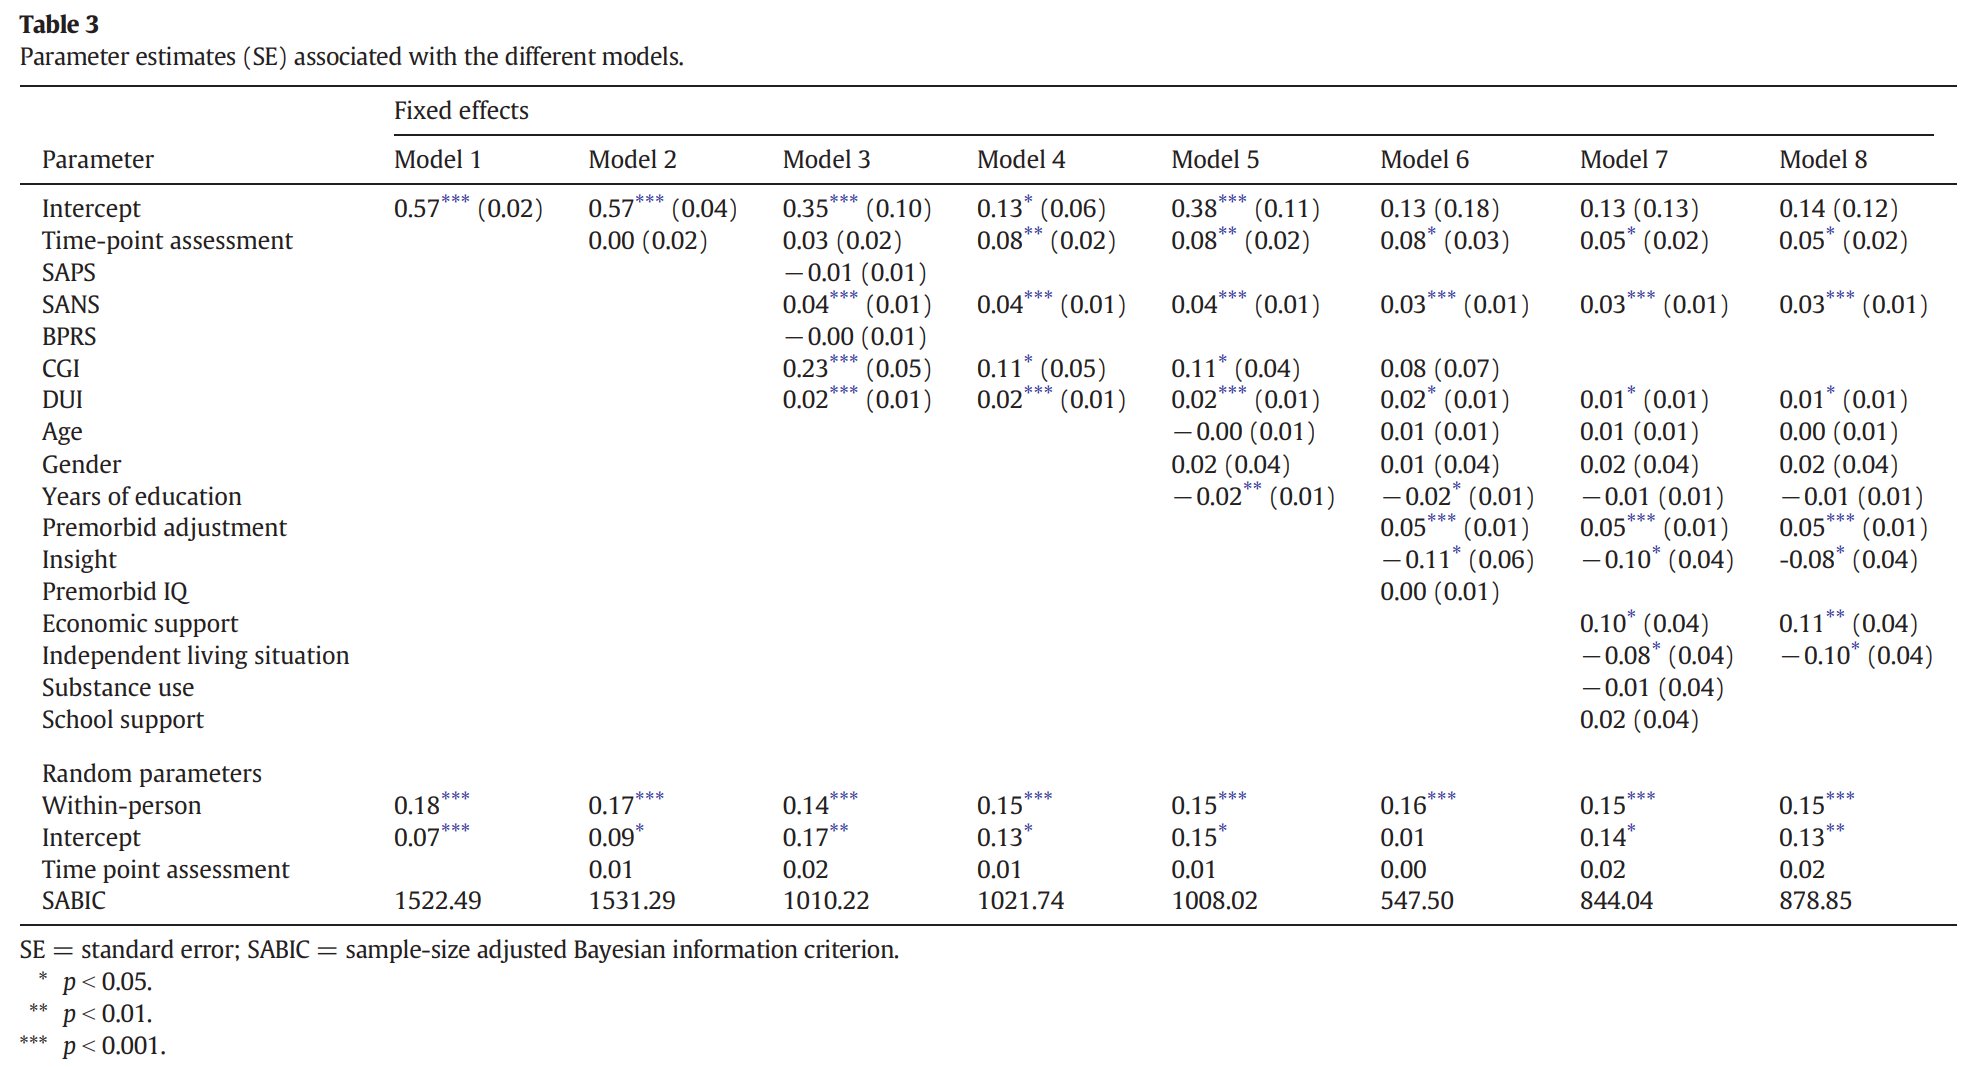
Disability multilevel modelling in first episodes of psychosis at 3-year follow-up
| Concept | Article Details |
|---|---|
| Terms | multilevel modeling statistical approach to repeated measures data, growth model |
| Samples |
|
| Time | Very unclear, but it does include “linear time” in the results |
| Missing | Only patients providing data for all the study variables during follow-up, and those who were assessed from the beginning of the study to the 1-year and 3-year follow-up were finally analyzed. |
| Centering | -not mentioned- |
| Components | group comparisons with Cohen’s d effect sizes, and decrease in Bayesian Information Criterion adjusted to sample size (SABIC) used to assess significance when comparing models, RIAS: Random intercepts and slope of time, assumption checking |
| Results | Table comparing nested models |
| Software | Mplus 6.11 |